Graph your Facebook friends
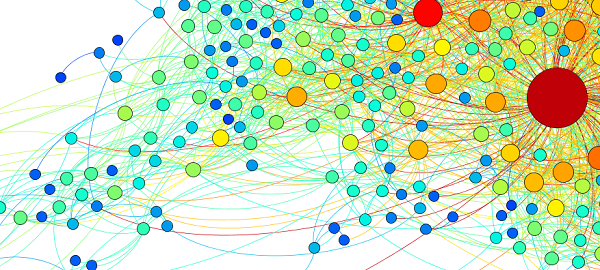
As a computer science nerd, I probably get a little too excited by data visualizations and graphing. I particularly miss the Nexus facebook application, and have been looking around for a decent replacement. The lead picture is an example of a graph I’ve generated using the following method, detailed after the cut.
I hope you don’t mind, but names have been omitted on my examples. If you know me, you can probably guess a few of the people based simply on the size and relative location of the node.
Download data and program
While I haven’t seen any facebook apps that have satisfied my curiosity, I have found a desktop app or two. A key tool here is the ability to export your social graph, via the facebook application NameGenWeb. I’ve tried a couple other data export apps, but this is the only one that doesn’t choke on my large network – YMMV. NameGenWeb offers a few different file formats; try the GUESS format and wait for it to generate, then save the file.
The program I’ve found that I’ve liked the best is Gephi, which supports opening several popular graph types. When you’ve installed it, you should be able to double click and open the file you downloaded from NameGenWeb. It will look sort of like the following:

Layout
At this point we’re going to arrange the data so that people that know each other will be closer together. In the lower-left pane (“Layout”), click “Choose a layout” and select “Force Atlas.” Run it for a while, and hit the stop button when you are satisfied. Depending on the size of your graph, it could take quite some time for it to work to satisfaction. There are several other layout algorithms, I recommend that you reload your file and try each of them to see how they affect your data. I noticed that “Force Atlas” makes a somewhat dense field in tightly connected subgraphs, while Fruchterman Reingold attempts to evenly distribute the points while still clustering them in a relational sense, making for better analysis of larger subnetworks. Yifan Hu goes for a very, very tight clustering but makes for clearer relations between large subnetworks.
You may notice that you have points that are not connected to other points- these are friends that you have no friends in common with. To remove them, look to the right side of the screen at “Filters” and open the “Topology” folder. Drag “In Degree Range” down to the “Queries” screen. Select the new filter and adjust the slider below to say at least 2. This will clean up your graph and help focus it on the relationships between points.
This is what mine looks like after Force Atlas:

And this is Fruchterman Reingold:

And yes, it looks a little messy. The rendered graph, even at this point, is quite beautiful. Hop over to the Preview tab to see what you have so far. Now, back to the Overview tab to work on it some more!
Size and color
Now we’re going to turn this drab graph into a work of art! On the right, go to the “Statistics” tab and hit the “Run” button to the right of the “Avg. Path Length” and click through the prompt and results. Now you can go to the “Ranking” tab on the left, and select “Ranking” and then you can choose either a color scale or a size scale (or, my preference, both) based on that factor. To switch from color to size, click the icon that resembles a pink diamond.
This is also where a lot of the color from your graph will come from- good color choices will make it visually appealing. You may notice that with the Force Atlas layout, the nodes will overlap. You can re-run Force Atlas with “Adjust by Sizes” checked to compensate for this problem. Here’s what mine looks like so far:

Final steps
Look up at the top of the window and click the “Preview” button. Here you have various options such as label size, color, etc. One option I like to change is the line color, which you can set to be a blend of the two nodes it is connected to. You can also set the background and node border color for interesting visuals. Also note the “proportional label size” option, which will set larger labels on larger nodes. Sometimes you may want to make a graph without labels, or even without the nodes themselves. To export the graph you’ve made, click the svg/pdf text at the bottom-left of the preview window, select a format, and save.
Here’s what mine looks like, rendered in the “Preview” window:

Further analysis
Gephi can detect subnetworks (for example, everyone you went to high school with). On the statistics window, run the Modularity report. On the left, there’s a “Partition” window. Hit the refresh button in it and select “Modularity Class” in the drop down box next to it. Hit apply for it to color the graph, highlighting those subnetworks. I’ve annotated one such example (click through to it if you desire):

Right click on the Partition window and click “Randomize Colors” until you are happy with the color scheme. Another fun trick is to click the “Group” button to get a rather abstract view on who you know. However, save your project first as I’ve managed to crash Gephi twice while using the Group functionality.
With any luck, I’ve taught you something about yourself today! Or at least, something about who you know.
Leave a Reply